General Electric Company (GE) has a special place in me because I spent almost 5 years serving in the multinational congromerate from 2008 to 2012. I am always proud to tell people around me that I was once an employee of GE, the 128-year-old company that was founded by Thomas Edison and the once most admired company in the world. It was GE which has exposed me to how a successful American business is being operated, thought me the importance of INTEGRITY and thanks to GE, I had the opportunity to visit the many interesting places in the U.S. including New York City, Washington D.C, Boston, Niagra Falls, Montreal and Toronto in Canada, when I was attending my GE trainings in Niskayuna, New York and countries including Taiwan, South Korea, Australia and Japan when I was serving as a field engineer. If it wasn’t for GE, I wouldn’t have spent 2 years of my lifetime learning the Japanese culture while living in Japan and experienced the Great Japanese earthquake on 11 March 2011.
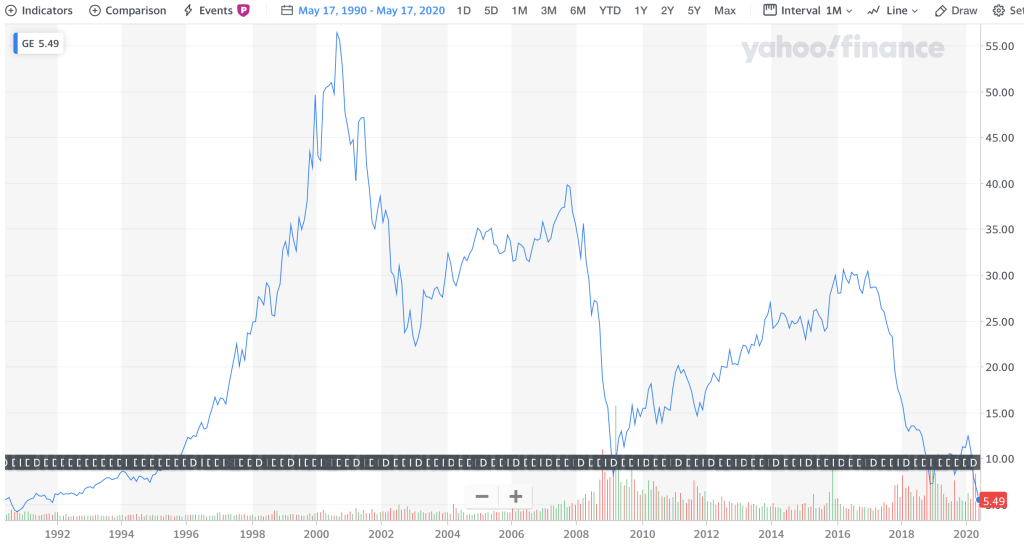
GE was once the most valuable public company in the world, with a peak market capitalisation of $600 billion back in August 2000. However on last Friday, 15 May 2020, GE was last traded at $5.49 a share, with a market capitalisation of $48 billion, which is a mere 8% of its peak market capitalisation. I am sure you can find easily from the internet the troubles in the company which had led it to where it is today, which I will not discuss here. The tiny valuation the market has given to GE today had me wondered if the company can even survive the COVID-19 pandemic crisis and so I’ve carried out the Altman Z-Score analysis on GE.
Altman Z-Score
Altman Z-Score is thought in every business school to measure a company’s likelihood of going bankrupt. The formula is developed in 1967 by NYU Stern finance professor Edward Altman to gauge financial distress level in a company, with high level of accuracy of between 82% and 94%. The Z-score is calculated based on 5 financial ratios which can be calculated from the information found in a company’s financial statements. It measures profitability, leverage, liquidity, solvency and activity to predict whether a company has a high chance of becoming insolvent.
Altman Z-Score = 1.2X1 + 1.4X2 + 3.3X3 + 0.6X4 + X5
where:
X1 = Net working capital / Total assets
X2 = Retained earnings / Total assets
X3 = EBIT / Total assets
X4 = Market value of equity / Total liabilities
X5 = Sales / Total assets
Z-Score > 3 = Safe
2.99 > Z-Score > 1.23 = On Alert
Z-Score < 1.23 = Distress
Financial Analysis of GE
The following data are extracted from GE’s latest financial statements, Yahoo Finance and WSJ:
| Item Description | Amount in USD | Remarks |
|---|---|---|
| Revenue | 93,536,000,000 | TTM |
| Operating Profit or EBIT | 4,557,000,000 | TTM |
| Inventories | 15,457,000,000 | 31-Mar-2020 |
| Receivables | 27,428,000,000 | 31-Mar-2020 |
| Payables | 35,030,000,000 | 31-Mar-2020 |
| Total assets | 262,021,000,000 | 31-Mar-2020 |
| Total liabilities | 225,162,000,000 | 31-Mar-2020 |
| Total equity | 36,859,000,000 | 31-Mar-2020 |
| Retained earnings | 82,796,000,000 | 31-Mar-2020 |
| Market value of equity | 48,022,000,000 | 15-May-2020 |
| Cash & cash equivalent | 47,286,000,000 | 31-Mar-2020 |
| Investment securities | 42,299,000,000 | 31-Mar-2020 |
| Total debt | 84,510,000,000 | 31-Mar-2020 |
| Cash flow from operation (CFFO) | 8,436,000,000 | TTM |
| Capital expenditure | 5,718,000,000 | TTM |
| Free cash flow (FCF) | 2,718,000,000 | TTM |
Net working capital = Inventories + Receivables – Payables = $7,855,000,000
| Ratio | Value |
|---|---|
| X1 = Net working capital / Total assets | 0.03 |
| X2 = Retained earnings / Total assets | 0.32 |
| X3 = EBIT / Total assets | 0.02 |
| X4 = Market value of equity / Total liabilities | 0.21 |
| X5 = Sales / Total assets | 0.36 |
| Altman Z-Score = 1.2X1 + 1.4X2 + 3.3X3 + 0.6X4 + X5 | 1.02 |
From the Altman Z-Score analysis, it shows that the company is in the financial distress zone where probability of financial catasrophe is high. However, I need to note that Altman Z-Score is only one of the method to gauge financial distress of a company and it was originally developed to analyse manufacturing based company while the GE congromerate today consist of its Aviation, Power & Renewables, Healthcare and GE Capital businesses.
It is important to note that GE’s aviation business contribution to sales and profit had been the biggest and most profitable, contributing as much as $32.9 billion in revenue and $6.82 billion in profit last year. It is the business that GE hinges its turnaround plan on. However, bad luck hits the company when the airlines industry had now been crippled by the COVID-19 pandemic, where global commercial air traffic is expected to fall 80% in second quarter compared with early February 2020, resulting in aircraft manufacturers cutting down production and giving GE’s darling aircraft engine business a direct blow. GE had recently reported 40% drop in profits from its aviation unit in Q12020, while the company expects the second quarter to be no better as GE announced that it is cutting 13,000 jobs in its jet engine business. The company had already shed 78,000 jobs last year.
So how will GE’s Altman Z-Score look like in the coming future? Will it get better? The answer is obvious as both sales and profit are expected to fall, resulting in lower X3 and X5 in the formula.
Will GE go bankrupt soon? Maybe not as its liquidity is ok after the recent sale of its biopharma business for $20 billion, building itself a large cash cushion. It’s current ratio is at 1.89 while quick ratio at 1.67.
I last bought shares of GE in 2009/2010 at $14 a share and sold all of them at $24 a share when I left the company in 2012. At current price of $5.49, it looks like a really good bargain. In fact, my dad asked me a few days ago to invest in GE’s share now that it’s price had hit the all time low level. After the above analysis, I will give it a skip.
Disclaimer
The information used in this article is obtained from reliable and publicly available sources but its accuracy and/or completeness is not guaranteed. Opinions are subject to change with the latest developments without prior notice. I accept no liability for any direct or indirect losses arising from the use of this article. The people involved in the preparation of this article may have positions or interests in the securities and/or companies mentioned herein. Do not buy or sell stocks and/or other securities based solely on the information presented in this article.
