A few days ago my uncle asked me what is my thought about this company called FINTEC Global Berhad as its Price to Earnings ratio (“PE ratio”) is only 0.27. Is it super undervalued and should he invest his money into this company hoping that one day the market will suddenly discover this “GEM” and see its share price rocket to the moon? I have never heard about this company but promised him I will give it a look and here’s my analysis.
First Impression
To be honest, my first impression about this company wasn’t good at all simply because of the name of the company – FINTEC. As in Financial Technology? Nobody calls themselves by the name of its own industry if that’s even the case here. What’s the intention? It’s like Tesla renaming itself to be Electric Car Inc. so that others know that it is actually producing electric cars? Or that guy who name himself Handsome Lim and you bet that he is not handsome at all as a handsome guy doesn’t need to do that to attract attention. This also reminds me that back in the dot-com bubble era in 1999/2000, companies tend to add “dot com” at the back of their name so that they can fetch a loafty valuation by the market.
Upon quick check from Bursa website, this company was originally Asia Bioenergy Technologies Berhad and changed its name to Fintech Global Berhad back in December 2017, about the time when the market was talking about investing in the rise of financial technologies companies like Paypal, Ant Financial (“Alipay”), Square, etc. But is this even a fintech company?
PE Ratio
Let’s briefly talk about PE ratio for those who are not very familiar with this term. Price to earnings ratio is very likely the most widely used (and probably the only one used by many) relative valuation method out there, simply because it is easy, straight forward and quick to help one find out if a company is expensive or not. It tells you how many times you are paying for the net profit a company is generating. A higher PE ratio tells you a stock is relatively expensive while a lower ratio means it may be relatively cheap. PE is calculated as follow:
PE = Market Capitalisation / Net Profit
But it is also because of its simplicity that it can fool investor into believing that it is buying a company’s share at a very cheap price. Trading at RM0.045 a share at the close of 22 May 2020 with market capitalisation of RM42.6million, at PE of 0.27 only, is FINTEC really that cheap to buy?
About the company
Listed on 12 December 2008, this company states in its annual report that it is:
A technology incubator that provides management and strategic advisory services, research related services and activities, business networking and funding for its incubatee companies.
The Company is an investment holding company and has, in conformity with the expansive investment strategies adopted by the management, taken strategic stakes in a number of listed companies. These are investments that the Company regards as having unlocked value, which can be unlocked through inventiveness, collaboration and cross-selling opportunities.
Fintec Global Berhad Annual Report 2019
So what does it really do? It basically has 4 business segments, namely Portfolio Investment, Green Technology Products, Oil & Gas services and Trading but revenue for the company is mainly generated from the sale of marketable securities. In other words, the company basically takes shareholders money, buy a bunch of stocks and hope for those stocks to appreciate in value, sell them, make profit and so “maximise” shareholder’s value. The company has investments in Vsolar Group Berhad, Focus Dynamics Group Berhad, Netx Holdings Berhad, AT Systematization Berhad, Mlabs System Berhad and DGB Asia Berhad. It also has investments in privately held companies which primarily involve in the production and trading of agricultural products like fertilisers which the company claimed as biotechnology products.
Security Analysis
The following are trailing 12 months (“TTM”) financial data from the last 4 quarterly reports released by the company.
| Description | Value in MYR |
|---|---|
| Revenue | 14,706,000 |
| Operating Profit | -14,085,000 |
| Fair value gain/loss on investment securities | 173,598,000 |
| Net Profit | 159,475,000 |
| Cash and cash equivalent | 27,999,000 |
| Short term investment | 42,367,000 |
| Long term investment | 277,291,000 |
| Plant, Properties & Equipment | 5,765,000 |
| Total assets | 370,973,000 |
| Short term debt | 23,256,000 |
| Total liabilities | 47,211,000 |
| Total equity | 323,762,000 |
| Cash flow from operations | -15,417,000 |
| Free cash flow | -17,969,000 |
The following summarises FINTEC past 5 years financial performance and position taken from its 2019 annual report:
| Financial Parameters | TTM | FYE March 2019 | FYE March 2018 | FYE March 2017 | FYE March 2016 | FYE March 2015 |
|---|---|---|---|---|---|---|
| Revenue | 14,706,000 | 15,357,478 | 30,887,771 | 5,354,052 | 9,518,186 | 53,232,689 |
| Net Profit | 159,475,000 | -40,051,372 | 43,364,636 | 2,122,222 | -28,828,097 | -3,961,142 |
| Plant, properties & equipment | 5,765,000 | 4,769,787 | 3,154,703 | 6,832,641 | 7,869,843 | 11,345,806 |
| Marketable Securities | 277,291,000 | 97,767,377 | 124,468,604 | 43,740,371 | 25,082,345 | 0 |
| Share capital | 113,038,000 | 96,058,092 | 81,872,991 | 56,005,130 | 86,671,160 | 86,671,160 |
| Irredeemable Convertible Preference Shares (ICPS) | 30,082,000 | 43,175,440 | 53,227,783 | 0 | 0 | 0 |
| Reserves including retained earnings | 182,319,000 | 9,698,914 | 50,268,921 | -2,996,953 | -46,684,980 | -22,323,379 |
| Cash flow from operation | -15,417,000 | -27,269,521 | -19,779,797 | -16,166,101 | -716,841 | -36,959,307 |
| Capital expenditure | -2,552,000 | -2,073,607 | -24,168 | -26,305 | -277,588 | -8,068,919 |
| Free cash flow | -17,969,000 | -29,343,128 | -19,803,965 | -16,192,406 | -994,429 | -45,028,226 |
Notes:
- Rights issues in 2014 & 2017 raising more fund from shareholders;
- Share consolidation in 2017;
- Issuance of ICPS in 2017 to raise more fund;
1. Net Profit more than Revenue?
From Table 1, you can see that revenue booked is actually only RM14m but net profit is a staggering RM159m. How can this be?
That is because revenue is generated when it sells its marketable securities while net profit has been contributed by fair value gains of RM173.6m booked from its investments marked to market. In the last 12 months, FINTEC is actually losing RM14m from its operations!! It is important to note that fair value gains are not actual transactional profit but merely marking the value of its investments to the latest market value. Fair value changes when market value of those investment changes from time to time. The company is actually registering a negative RM18m in free cash flow in the trailing 12 months.
No wonder it has a PE ratio of 0.27, dividing its market capitalisation of RM42.6 million by net earnings of RM159 million gives you 0.27. But are those real earnings? Not until it sells those marketable securities and convert them into cash. Is the company undervalued? Is this PE ratio sustainable?
2. Is the low PE Ratio sustainable?
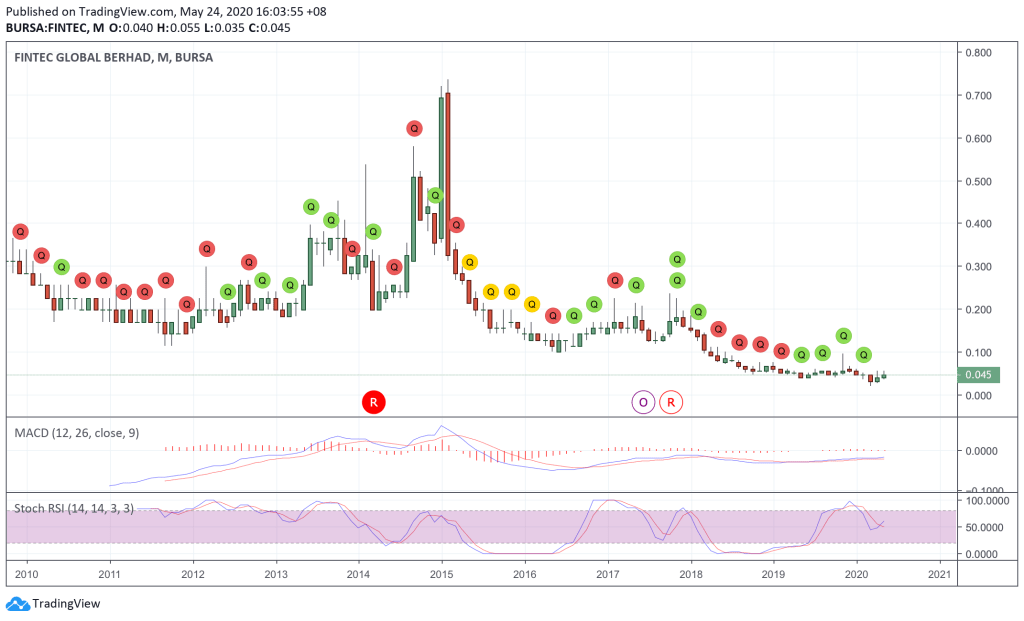
If you look at revenue and net profit for the past 5 years as presented in Table 2, both have been through roller coaster ride. Net profit figure has been the more obvious one, with losses in 2015, 2016 and 2019 while profits in 2017, 2018 and the last 12 months. By this trend, PE ratio was negative for 2015, 2016 and 2019 while positive in 2017, 2018 and the last 12 months. No wonder the share price of this company has also followed a roller coaster trend, averaging around RM0.20 between late 2010 to mid 2013, peaking at RM0.70 in 2015 but has since saw its share price dropped 93% to RM0.045.
But how about the coming months? It is not difficult to predict. Just look at the share price performance in Q1 2020 (02 Jan 2020 to 31 March 2020) of some of the shares the company said it has invested into.
VSOLAR: -67%
Focus Dynamics: +36%
Netx: -60%
AT Systematization: -37.5%
Mlabs: -50%
DGB Asia: -85%
It is important to note that Fintec owns 25.188% or about 515 million shares of Focus Dynamics Group Berhad as of 3-Feb-2020, which is a company valued by the market at RM1.44 billion as of 22 May 2020. Based on the +36% gain in Focus Dynamics share price in Q12020, the soon to be released quarterly result is expected to be substantially contributed by this gain caused by marked to market valuation of its shareholdings of Focus Dynamics. But how about the rest of the year? They will depend a lot on the share price performance of Focus Dynamics.
The company had also as recent as 14 May 2020 made a public announcement through Bursa that it had on 19 March 2020, 24 March 2020, 1 April 2020 and 10 April 2020, acquired in aggregate 4.91% or 9,620,000 ordinary shares of Permaju Industries Berhad (“Permaju”) for an aggregate sum of RM8,633,860.85 in cash from the open market. A check on the share price performance of Permaju showed:
| Date | Closing Price, RM |
|---|---|
| 19-March-2020 | 0.865 |
| 24-March-2020 | 0.925 |
| 1-April-2020 | 0.935 |
| 10-April-2020 | 0.785 |
| 22-May-2020 | 0.61 |
Permaju Industries Bhd is Malaysia-based investment holding firm. The company is primarily engaged in sales and distribution of automobile vehicles.
3. Negative free cash flow every year resulting in the need to keep raising funds from shareholders
Like i explained earlier, the company’s net profit are due to fair value adjustment of its marketable securities and not from its underlying business. In fact, there is no underlying business that contributes significantly to its revenue and profit. One should look at the negative free cash flow that this company has reported in the past 5 years. See the last row of Table 2 for yourself. They have burnt through a total of RM111m of free cash flow from 2015 to 2019 and an additional RM33m in the last three quarters despite reporting huge net profit of RM172.6m.
This has resulted in the company needing to keep raising cash from its shareholders, with the issuance of rights issues in 2014 and 2017 as well as issuance of ICPS in 2017. It even had to borrow RM23m in the last reporting quarter to fund its operations!! FINTEC is in dire need for cash now. No wonder it has since 17 February 2020 proposed for a private placement of new shares representing up to 30% of total shares issued.
4. New plans to raise more funds for new business venture
Amid the COVID-19 pandemic, the management suddenly had a great idea to now venture into the PPE manufacturing. According to a recent news report by The Star, it expects to raise RM11.96 million for working capital and new investment into the healthcare equipment business. See the story here.
I wonder how the company plans to setup factories to start manufacturing those PPE knowing that it has no prior experience in this industry, the lead time it requires to purchase those equipment, hire those workers, or even if it is done through an acquisition, who is that acquisition target? After setting all these up, who will be their customers? Is the barrier of entry so low and frictionless? Even if it manages to start selling PPE, will the company make money selling those products? There are a lot of questions to think about here.
I also wonder who will be taking up that proposed private placement.
5. No underlying business
As you can see from my analysis above, this company has no underlying business that contributes meaningfully to its revenue and profit. It is taking shareholder’s money investing into the stock market. Sounds more like a closed-end fund like iCapital and had been burning cash every year, not to mention paying close to RM800,000 to its directors last year as reported in its 2019 annual report.
Why would an intelligent investor want to invest in FINTEC when the company has not proven that it can make investment decisions better than anyone else? An investor can instead make its own investments in the various quality public listed companies or put his money into mutual funds with proven track record.
Will the share price of FINTEC soar in the near term? Why not? The market is full of speculation, irrationality and is a voting machine in the short term. Should an intelligent investor put his/her hard earned money into this company? It is up to you to decide.
Update 26 May 2020
The analysis of FINTEC will not be complete without mentioning its lion share in Focus Dynamics Group Berhad. As of 03 February 2020, FINTEC owns 25.188% or about 515 million shares of Focus Dynamics Group Berhad, a company valued by the market at RM1.44 billion as of 22 May 2020. FINTEC’s shareholding is worth a whooping RM363m at the time of writing.
Focus Dynamics is primarily involved in the F&B business, owning whisky lounge, resto-lounge, etc. Business was good and growing, but that was before COVID-19 hits the shore of Malaysia. With the 2 months MCO and the new social distancing normal, you can think for yourself how will the pandemic affects its business. Pay attention to the coming quarterly reports from Focus Dynamics.
I can see now why investors out there has shown interest in FINTEC, i.e. it’s shareholding in Focus Dynamics. A company is valued at RM42.6m by the market when it actually owns RM363m worth of shares in another company. Well, too bad that other company is not expected to do well after the implementation of MCO and until COVID-19 disappear.
There is one way that share price of FINTEC can skyrocket to the moon quickly, that is for it to sell all of its shares in Focus Dynamics, convert that into cash and distribute most of that to shareholders. Even a RM200m cash dividend to shareholders representing RM0.21 per share will give the company a quick boost to its share price from the currently undemanding RM0.045. But will it sell? Like I explained earlier, market value of its investment is subject to change everyday until it convert those into cash.
Disclosure
I have no position in any of the stocks mentioned in this article at the time of writing, nor have any plans to initiate one in the next 3 months.
Disclaimer
The information used in this article is obtained from reliable and publicly available sources but its accuracy and/or completeness is not guaranteed. Opinions are subject to change with the latest developments without prior notice. I accept no liability for any direct or indirect losses arising from the use of this article. The people involved in the preparation of this article may have positions or interests in the securities and/or companies mentioned herein. Do not buy or sell stocks and/or other securities based solely on the information presented in this article.

Wow this is a really good analysis.
Keep up the good work!
LikeLike